


Part 1. To See Where You Should Be, Compare Yourself to Your Industry
By James Chittenden
Let’s put some more money in your pocket. The goal here is to help you find efficiencies within your business and increase your margins WITHOUT having to resort to layoffs, gimmicks, or imposing sticker shock pricing. Compare yourself to your industry and increase your profits.
In Part 1, we are going to show you how to increase your profits by showing you how to compare the financial performance of your business with the rest of your industry.
Let your competitors be your guide.
Step 1
Get the NAICS (North American Industry Classification System) code for your business here. Your NAICS code makes it possible to gather and review statistics for an entire industry and see how you compare.
NAICS provides information on businesses from Canada, Mexico and the US. An industry is given a six-digit identifier which is the NAICS code. It is like a ZIP code. They are used to compile information about industries. For example, when the bank takes a business loan application, the NAICS code of the business is part of it. Loan defaults are tracked based on NAICS codes.
Enter the applicable keywords and locate your NAICS code.
If more than one applies, use them. For example, an interior design business may consult and also sell custom furnishings. Therefore they may have the following NAICS codes:
541410 Interior Design Consulting Services
337212 Custom Architectural Woodwork and Millwork Manufacturing
The activity that accounts for the majority of your sales is the primary NAICS code for your business.
Step 2
Use Bizminer or another research platform to see how your business performs compared to other businesses in your industry.

Bizminer is a subscription-based service that complies data from business operations. They gather data from banks and governments. That data is used as benchmarks for bank loans and to gauge the financial health of businesses. Get your NAICS code and visit Bizminer.
In this example provided by Bizminer, we will look at a fictitious company called Foundation Plumbing of Harrisburg, PA. We can compare them against plumbing, heating and air-conditioning contractors in a selected geographical area (Harrisburg) with sales between $1 million and $2.5 million, which is roughly the size of Foundation Plumbing. It is part of the Construction sector. Their NAICS code is 238220.

Step 3
In order to compare yourself to peers, you will need your most recent financial statements. Specifically, gather your income statements and balance sheets for at least the past two years.
If your books need improvement, you can hire a part-time bookkeeper from Bench (see pricing and start a free trial here). For a relatively low price, your Bench bookkeeper can prepare your financial statements and reconcile your bank transactions each month. For the do-it-yourselfer, we recommend Quickbooks.
One this is done, you will have a complete record of key ratios in your business. The one we are concerned with here is profit margins.
You can calculate the profit margin ratio by subtracting your total expenses from your total revenue, and then dividing this number by total expenses. The formula is: (Total Revenue – Total Expenses) / Total Revenue.
Step 4
Get an industry report from Bizminer and compare your results to that of your competitors.
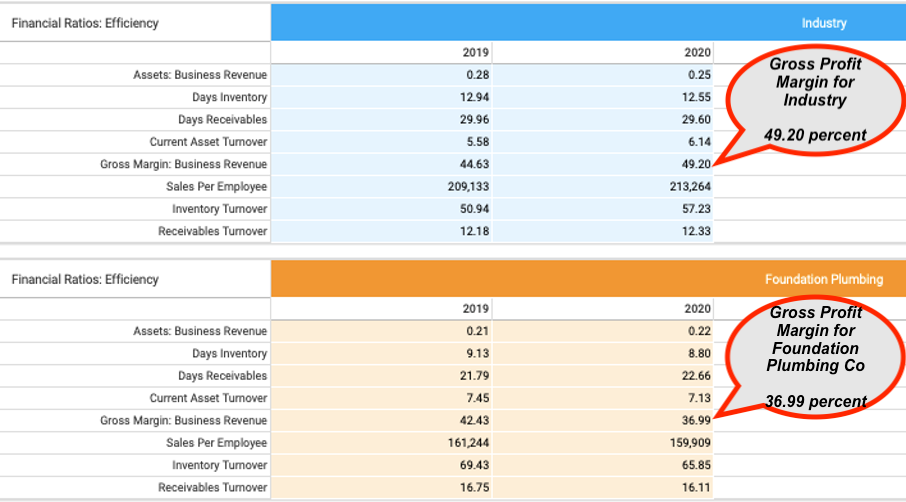
Back to our example. We compared ratios for Foundation Plumbing with those of the overall industry. While we will not go into great detail, we will focus on gross margins. In 2019 the industry average was 45 percent and Foundation Plumbing slightly underperformed at 42 percent. However, in 2020, the industry performed at 49 percent while Foundation Plumbing underperformed at 37 percent.
There are many ratios that offer clues as to the reasons for this. For example, sales per employee for the industry are $213,264 while Foundation Plumbing sales per employee is $159, 909. Why?
Other examples include, but are not limited to:
Inventory turnover for the industry is 57.23. This means that the average business in this industry and this market sold, or “turned over” it’s inventory just over 57 times during the year. Foundation Plumbing slightly outperformed the industry at 65.85, suggesting that they are efficiently managing inventory.
Receivables turnover offers some insights as well. At 16.11, Foundation Plumbing turns receivables into cash just over 16 times per year. They outperform their industry peers, who are at 12.33. At first glance, this is positive. It indicates a higher proportion of creditworthy customers and efficient collection practices. However, it can also indicate that a company’s tight credit policies are hurting sales.
The owners’ task is now to evaluate the causes of underperformance, so that they can increase their profit margins to their full potential.
How to get these reports
Bizminer reports are comprehensive, detailed, and require familiarity with financial statements in order to be useful. They also require a financial investment. Yearly subscriptions are available and so are individual industry reports (options are U.S.-wide or local). To see what those costs are, see Bizminer, then Report Search, then Industry Search Tools. If you are a business with local customers and local competitors, select “Local Industry Financial Reports”.
Many local library systems and universities subscribe to Bizminer. If so, a library card or university-issued identification gets you in for free. Also, Bizminer reports are available from Small Business Development Centers (SBDCs).
The Ohio University library published this brief video tutorial on using Bizminer to research financial and market conditions.
And finally…
Welcome to One Click Advisor! We would be remiss if we didn’t give you a brief tour of the site and what it can do for you. The free Business Builder is a consulting session, solving your business plan questions in minutes. Your challenges and opportunities can be sorted into one of three areas.
Marketing, because it brings in the customers. Start or continue that plan here.
Operations, because it keeps your customers. Start or continue that plan here.
Finance, because it is the scoreboard. Change the “score” and explore financing here.
Compare yourself to your industry so that you can meet or exceed your profit goals.